Validate your success and build trust with the Results & Impact Statistics Widget. This component is designed to turn dry data into a compelling visual narrative, perfect for case study summaries, "Our Impact" sections, or SaaS performance metrics.
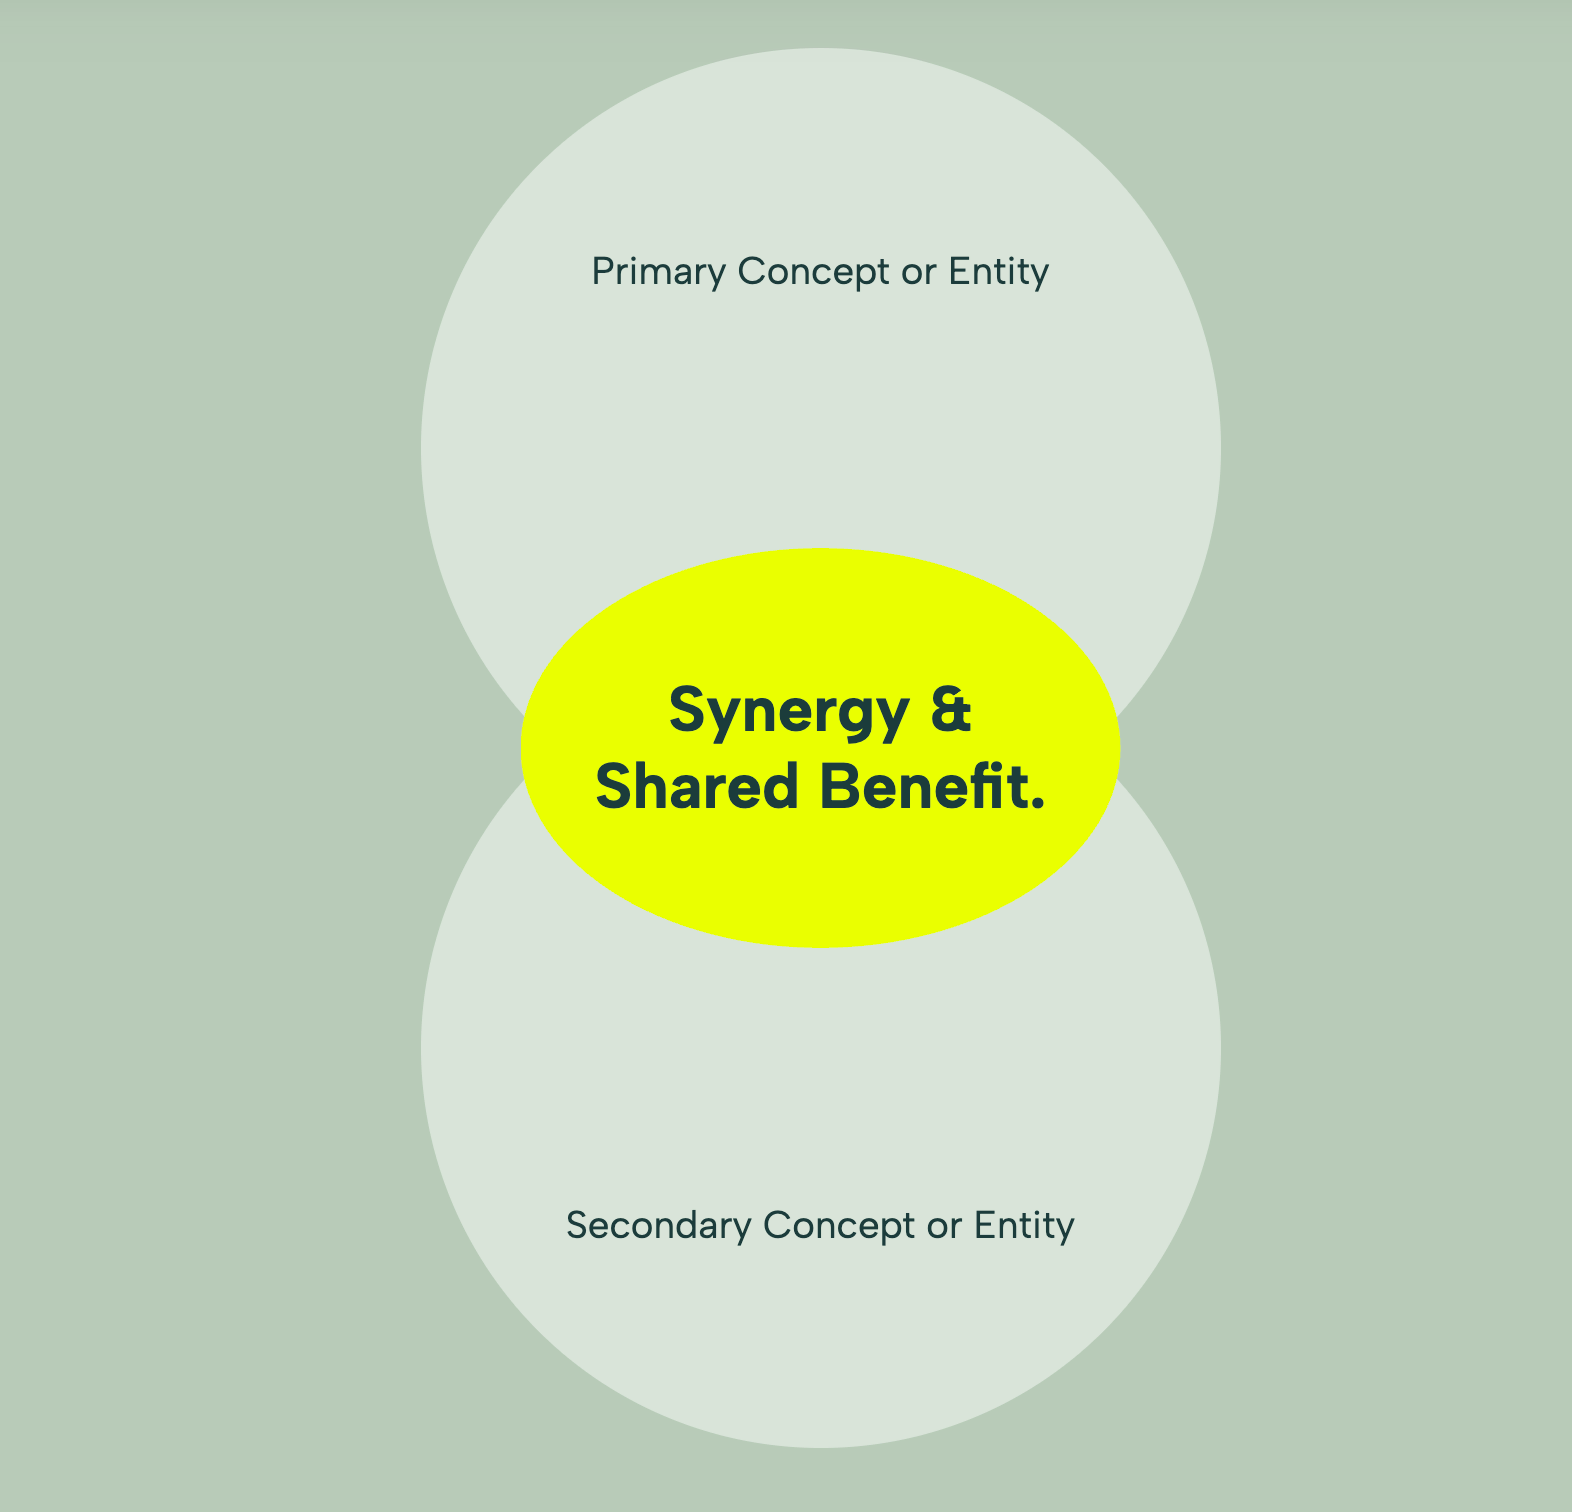
The visual anchor of this widget is the SVG Concentric Circle Background. These three layered rings sit behind the content, adding depth and a subtle, modern aesthetic that draws the user's eye toward the center of the screen. Because they are built with CSS/HTML (divs with borders), you can fully customize the color and opacity of each ring to match your brand's theme—whether you want a faint watermark effect or bold, colorful rings.
In the foreground, the widget features a Responsive Stats Grid. The layout begins with a centered typographic introduction (Label, Headline, and Description) to set the context. Below, your key metrics are displayed in clean, floating cards. Each card supports a hierarchy of information: a massive number for the data point, an uppercase label for category identification, and a short description for context.
Key Features:
Bring this layout to life on your website in just a few clicks.

Edit visually using the extension or native blocks
First, ensure you have pasted the global Redesignee connector script into your site's Code Injection settings. Once connected, you have two easy ways to build:
Native Block: Simply add the native Redesignee Widget Block directly from the fluid engine editor menu inside Squarespace.
Manual Markdown: Add a standard Markdown Block, paste your widget’s code snippet, and the Redesignee floating "Customize" button will automatically appear right over the block.
Both methods let you tweak settings, copy items, and design visually in real time. Saving your changes syncs the updates instantly to your live page.
See Squarespace installation guide
Connect natively via Gutenberg or Elementor
Make sure you have the free Redesignee WordPress Plugin installed. If you are using Elementor, simply drag and drop the Redesignee widget from your sidebar. If you are using the Gutenberg Block Editor, click the " + " icon and select the Redesignee Block. Launch the Cloud Library directly inside your workspace, choose your customized template, and import it with a single click. It automatically inherits your theme fonts and styles!
WordPress plugin installation guide
Quick copy-and-paste for custom setups
If you are using Webflow, Shopify, Wix, or a custom HTML site, click the "Export Widget" button on this page and ensure the platform selector is set to"HTML". Click "Copy" to copy the clean, un-nested source code snippet directly to your clipboard. Paste this code into any HTML component, Code Block, or Embed tool inside your website builder. All styles, animations, and scripts are self-contained and ready to run.
Published:
Jan 13, 2026 02:25 AM
Category: